Features of Concurrency Visualizer:
- Shift+Alt+F5
- Fast processing, faster loading
o Supports big traces - Supports big traces
- Support s EventSource and custom markers
o Built-in support for TPL, PLINQ, Sync Data Structures, and Dataflow
o Built-in support for your own EventSource types
§ Also provides Visual Studio markers API - New Visualizations
o e.g. defender view
Demo:
Here are few steps to know that how to utilize “Concurrency Visualizer” for multithreaded applications.
- Create a Console project.
- Create custom EventSource to trace in the visualizer as below:
[EventSource(Guid = "7BBB4E52-7DA7-45EB-B6C2-C01D460A087C")]
class MyEventSource : EventSource
{
    internal static MyEventSource log = new MyEventSource();

    [Event(1)]
    public void SomeEventHandled(int data)
    {
        WriteEvent(1, data);
    }
}
To provide GUID to the event source use “guidgen” and copy newly generated GUID. Then put it in the attribute of the EventSource class. - Now complete the test code to proceed the demo.
Full code snippet:using System.Threading;
using System.Threading.Tasks;
namespace ConcurrencyVisualizerDemo
{
class Program
{
static void Main(string[] args)
{
var list = new List<Task>();
for (int i = 0; i < 10; i++)
{
list.Add(Task.Run(() =>
{
//Loging here
MyEventSource.log.SomeEventHandled(21);
Thread.SpinWait(1000000);
}));
}
Task.WaitAll(list.ToArray());
}
[EventSource(Guid = "7BBB4E52-7DA7-45EB-B6C2-C01D460A087C")]
class MyEventSource : EventSource
{
internal static MyEventSource log = new MyEventSource();
[Event(1)]
public void SomeEventHandled(int data)
{
WriteEvent(1, data);
}
}
}
} - There is optional extension “Concurrency Visualizer” for visual studio, which visual all the data to debug the concurrency between the treads. After installing this, you can find the option under Analyze menu. See image below:
- Now copy the GUID of MyEventSource and go to the Concurrency Visualizer’s settings. Then add new provider and put this copied guid in the provider.
Analyze->Concurrency Visualizer->Advance Settings->Markers
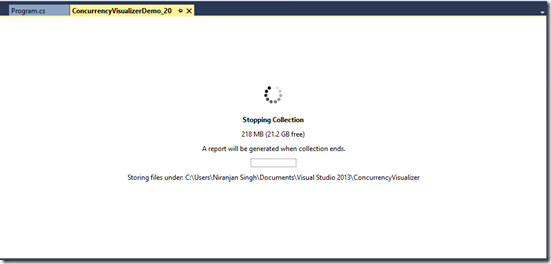
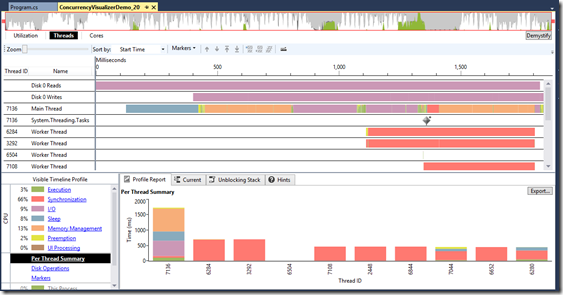
Provide name and paste copied guid in the Privider GUID field. Click ok to complete provider addition. - Now start Concurrency Visualizer by pressing Shift+Alt+F5 and it will start Shift+Alt+F5. Now it will start generating reports. See the below images:


No comments :
Post a Comment