The Microsoft Chart Controls for .NET Framework allows you create simple, feature rich and attractive 2D and 3D charts for web (ASP.NET) and windows applications (WinForms). In this article, we will explore ASP.NET Chart Controls. The ASP.NET chart controls enables you to create visually compelling charts for web applications and supports almost all major 2D/3D chart series types. You can download the samples here to check them out.
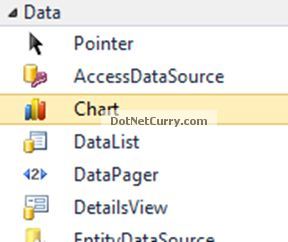
The ASP.NET Chart control is a part of the .NET Framework 4.0 release. If you are using ASP.NET 4.0, the Chart control is included in the ToolBox and you can drag and drop the chart control from the Data Tab to use it.
If you are using .NET 3.5 SP1, the chart control has to be separately downloaded over here.
Let us get started:
Step 1: Create an ASP.NET 4.0 website and drag and drop a chart control and a Button control from the toolbox to the Default.aspx webpage. Set up the chart control to use Area3DStyle to implement 3D for all series in chart area, as shown below:
<asp:Content ID="HeaderContent" runat="server" ContentPlaceHolderID="HeadContent">
</asp:Content>
<asp:Content ID="BodyContent" runat="server" ContentPlaceHolderID="MainContent">
<asp:Button ID="btnBind" runat="server" Text="Bind Chart to XML"
onclick="btnBind_Click" />
<asp:Chart ID="chartBooks" runat="server" Width="700" Height="450"
BackColor="LightBlue" BackSecondaryColor="AliceBlue"
BackGradientStyle="TopBottom" BorderColor="DarkBlue">
<Series>
<asp:Series Name="Series1" ChartArea="ChartArea1" ChartType="Column"
Color="Wheat">
</asp:Series>
</Series>
<ChartAreas>
<asp:ChartArea Name="ChartArea1" Area3DStyle-Enable3D="true"
BackColor="#0066cc" BorderColor="DarkBlue">
</asp:ChartArea>
</ChartAreas>
</asp:Chart>
</asp:Content>
Step 2: We be plotting the chart based on the XML Data. I have used a sample books.xml available in the source code of this article. Here's a sample structure of the XML file
Step 3: On the button click event, write the following code to populate the chart, with the data read from the XML File
C#
protected void btnBind_Click(object sender, EventArgs e)
{
string dataPath = MapPath(".") + "\\books.xml";
DataSet ds = new DataSet();
ds.ReadXml(dataPath);
DataTable dt = ds.Tables[0];
DataView dataView = new DataView(dt);
// Bind XML
chartBooks.Series[0].Points.DataBindXY(dataView, "title", dataView, "price");
}
VB.NET (Converted Code)
Protected Sub btnBind_Click(ByVal sender As Object, ByVal e As EventArgs)
Dim dataPath As String = MapPath(".") & "\books.xml"
Dim ds As New DataSet()
ds.ReadXml(dataPath)
Dim dt As DataTable = ds.Tables(0)
Dim dataView As New DataView(dt)
' Bind XML
chartBooks.Series(0).Points.DataBindXY(dataView, "title", dataView, "price")
End Sub
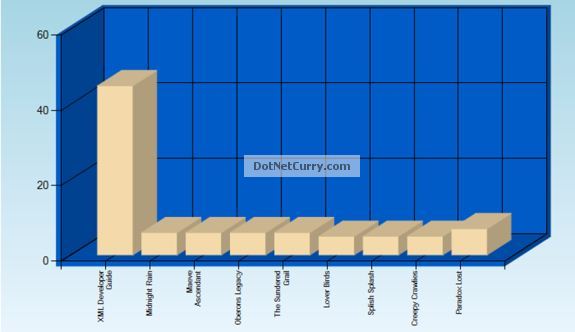
In the code shown above, we are using the DataSet.ReadXML to read the XML data into a DataSet. We then create a DataView using the DataTable (obtained from the DataSet) and then use 'DataBindXY' to bind the X and Y values of the collection to the specified column of the DataView, in our case 'title' on the X-Axis and 'price' on the Y-Axis.
That's it. The resultant output is as shown below:
No comments :
Post a Comment